Read the Overview dashboard
Overview
Section titled “Overview”Overview presents sales performance for the records you are permitted to see. Its main indicators include open pipeline, weighted forecast, won and lost value, win rate, activities due and average deal cycle. Charts show closed-won value and the distribution of open opportunities by pipeline stage.
Purpose
Section titled “Purpose”Prioritize work and review sales performance with a consistent date, owner, team and currency context.
Prerequisites
Section titled “Prerequisites”-
Dashboard/reporting access.
-
Record visibility for the underlying Leads, Deals and Activities.
Procedure
Section titled “Procedure”-
Open Workspace > Overview. Select the available view such as My performance, Team or Organization performance.
-
Expand Filters and choose the period. Set owner, team, pipeline and stage where these controls are available.
-
Apply the filters and choose a display currency. Financial figures remain separated by original currency; the selector is not a foreign-exchange conversion.
-
Read open pipeline and weighted forecast together. Compare the closed-won trend with the pipeline-by-stage distribution.
-
Review Sales performance by Owner or Team, then open the relevant records or Workqueue to act on the result.
Expected result
Section titled “Expected result”The dashboard presents scoped metrics for the selected reporting context.
Screenshots and diagrams
Section titled “Screenshots and diagrams”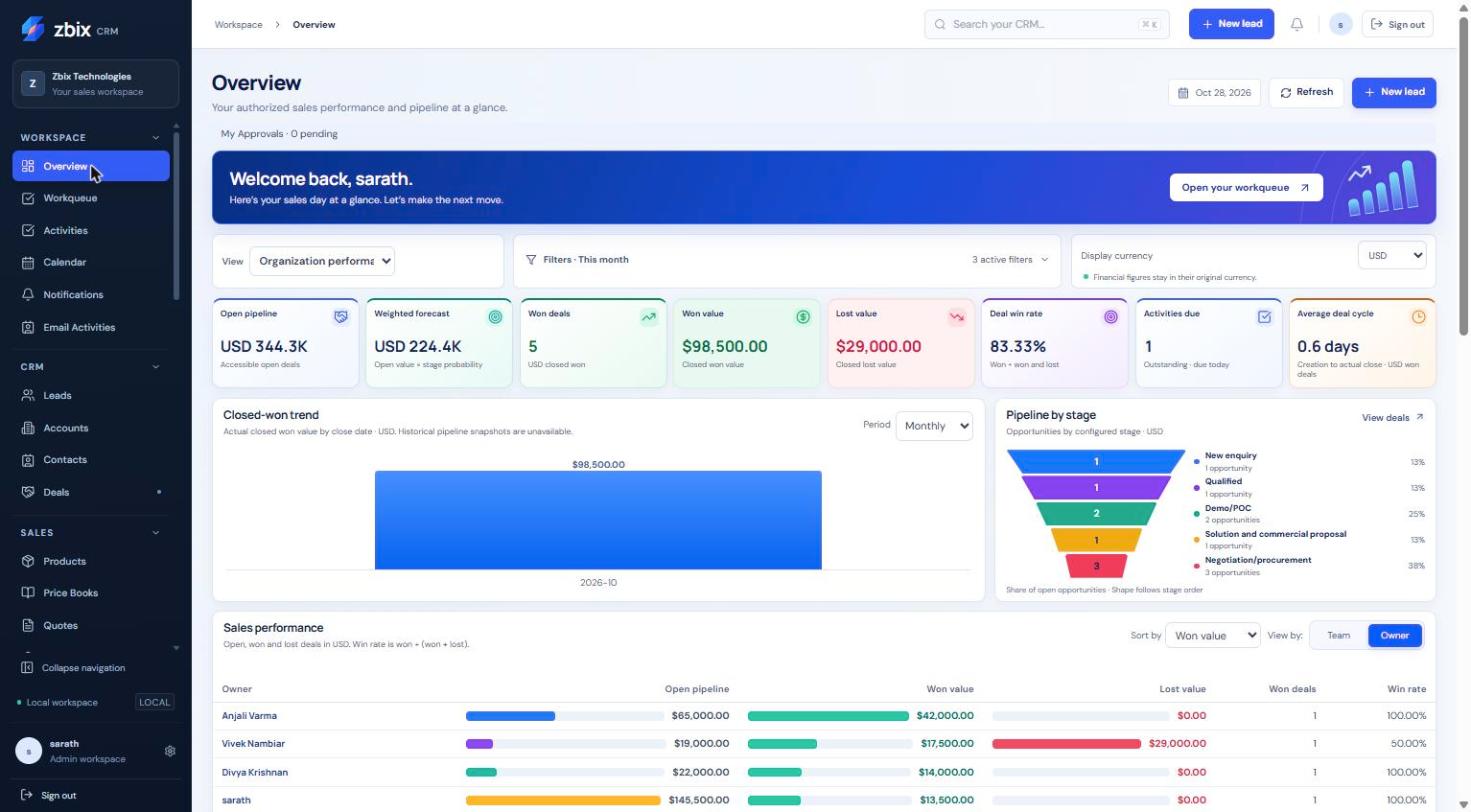
Important notes
Section titled “Important notes”-
Open opportunity, Lead and Activity periods use UTC creation dates; won/lost opportunity analysis uses the actual close date in the current reporting implementation.
-
Team memberships can overlap. Do not add team totals together as if every record belongs to exactly one team.
-
A weighted pipeline is a planning estimate based on probability; it is not contracted or collected revenue.
Troubleshooting
Section titled “Troubleshooting”-
Totals differ from a colleague’s: compare role visibility, view, date range, owners, pipeline and currency.
-
A chart is empty: confirm records meet the selected period and stage criteria before assuming missing data.
-
Won trend differs from new Deals: creation and close dates answer different questions.
Related articles
Section titled “Related articles”Search the guides or talk to the ZBIX team.


Software products, application engineering and IT services from Zbix Technologies.
Visit our company website ↗